Platinum Project: Redesigning PIMS for Refinery Production Planners
The Platinum project aimed to create a modern, intuitive UI for PIMS, a spreadsheet-based application used by refinery production planners. These planners oversee refinery operations, deciding which crude oil products to purchase and at what price, as well as determining the refinery’s output, such as unleaded gasoline or jet fuel. Their decisions balance economics (maximizing profit given variable constraints) and engineering (ensuring feasibility within refinery limitations).
The new UI introduced a flowsheet—a visual representation of the refinery’s processes—replacing the outdated paradigm of spreadsheets and tables. This marked a significant shift for planners, who historically relied on data-heavy interfaces. For reference, 70% of refineries worldwide use PIMS, while the remaining 30% rely on Excel.
The biggest challenge was the novelty of this approach. As a fundamentally new way for planners to interact with their data, usability testing and user feedback were critical to refining the design. Over the course of two years, I conducted numerous usability and validation sessions to iterate and improve the product. In addition to research, I contributed to the design by creating initial mockups and developing the iconography used throughout the UI.
The Platinum project successfully modernized PIMS, providing planners with a more visual, user-friendly interface that transformed how they analyze and act on refinery data.
Platinum Project: From Wireframes to Final Product
This gallery illustrates the design evolution of the Platinum Project for PIMS, showcasing the transition from initial wireframes to a high-fidelity interface and the final polished product.
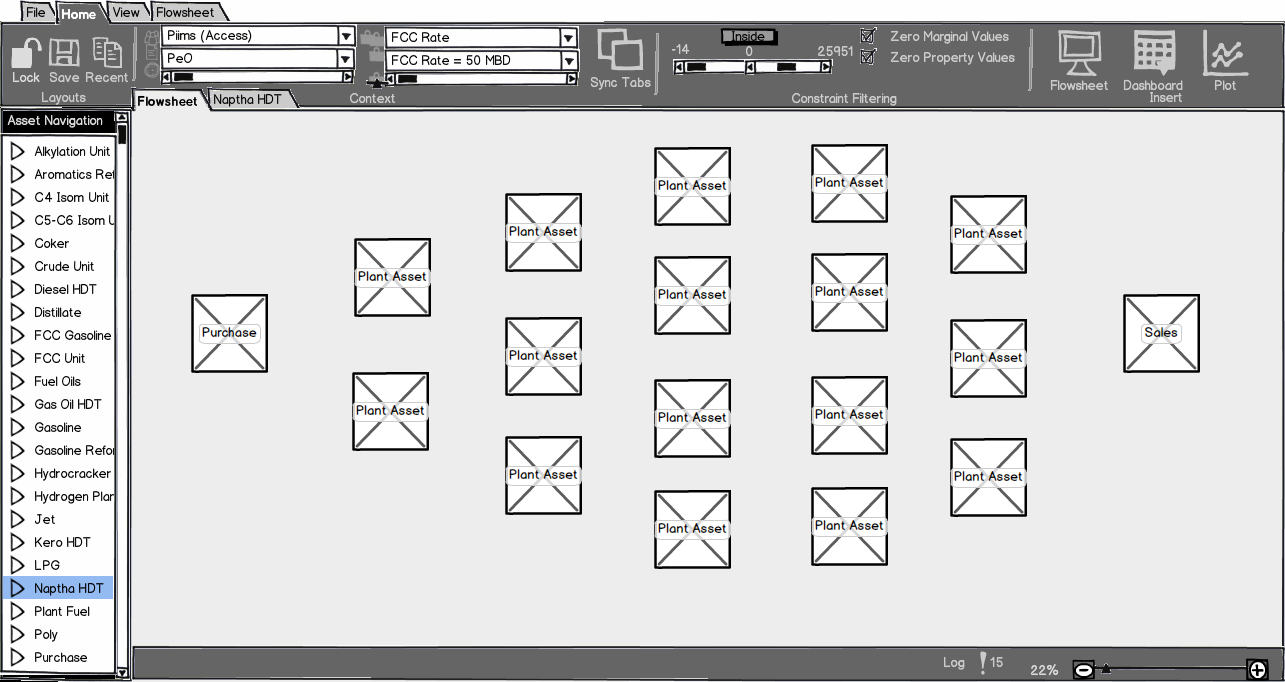
Wireframes: The early wireframes establish the foundation of the flowsheet concept, laying out the refinery’s process units in a simple, placeholder-based format to validate the layout and structure.
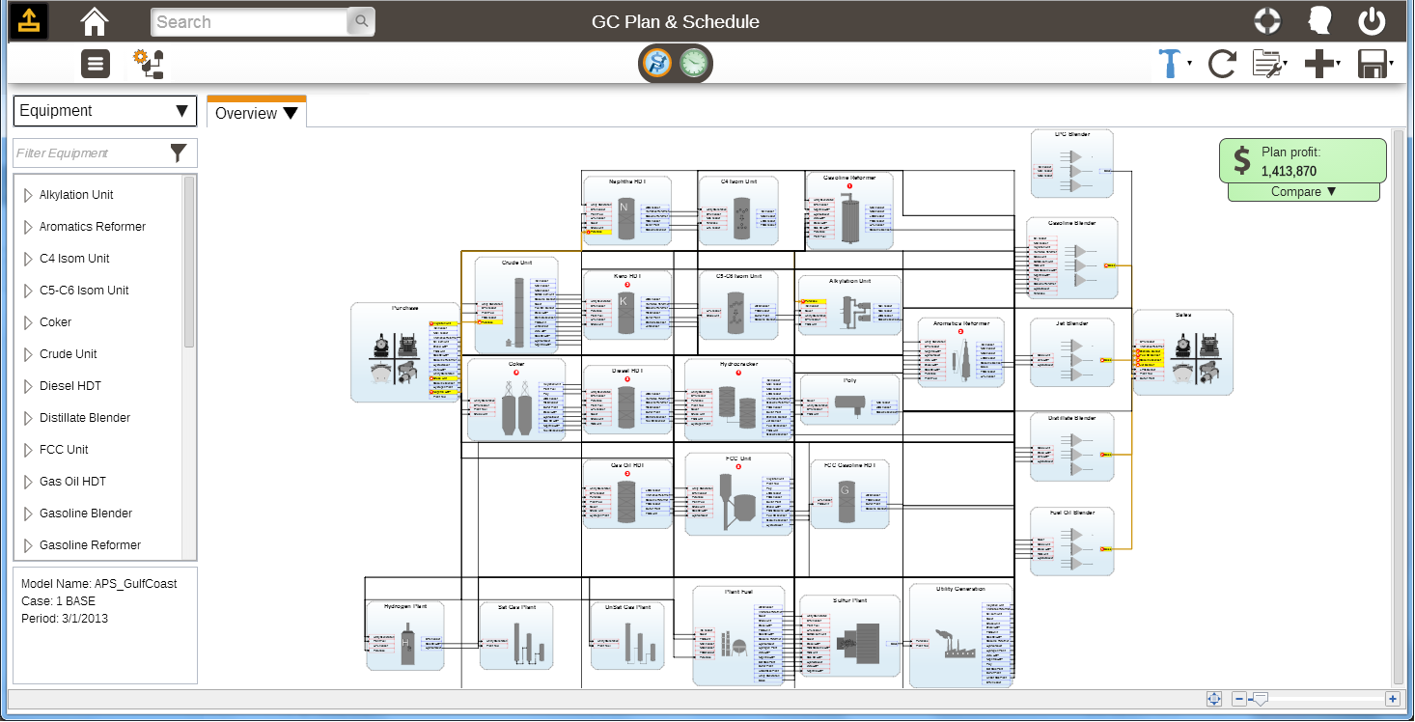
High-Fidelity Designs: These iterations refine the visual elements, incorporating more detail, realistic icons, and an improved user interface to enhance usability and clarity.
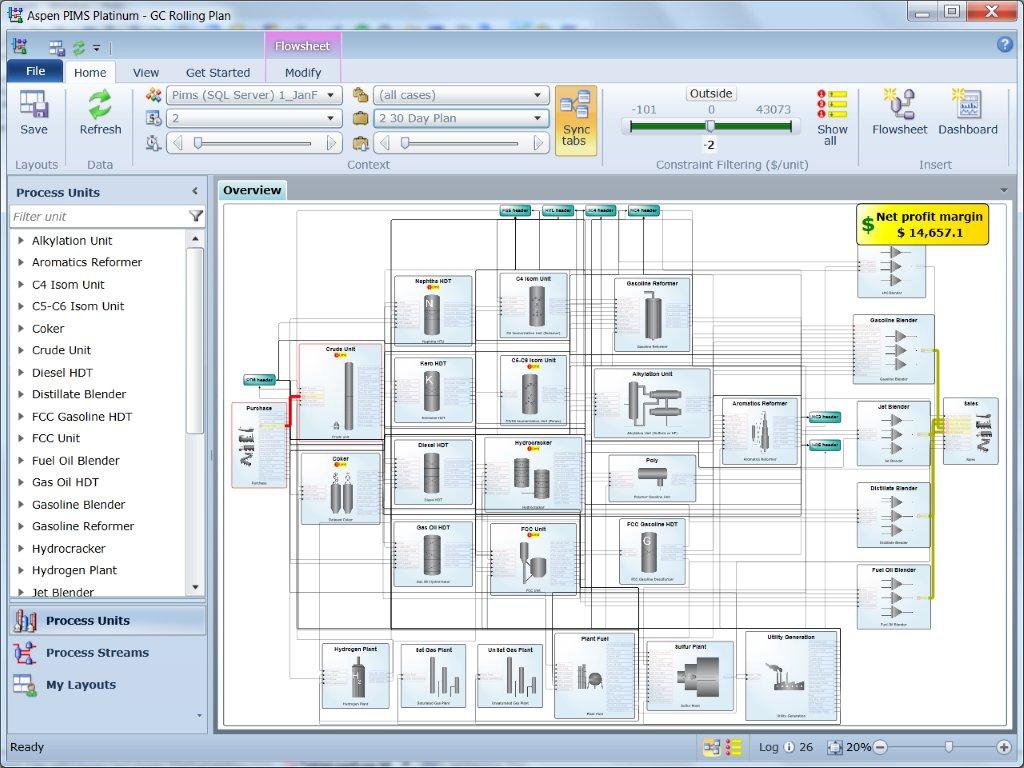
Final Product: The completed design brings everything together with polished visuals, cohesive iconography, and an intuitive interface. The flowsheet offers a modern alternative to the spreadsheet-based paradigm, transforming how planners interact with refinery data.